GOP Proposals That Cut Social Safety Net to Give Tax Breaks to the Wealthy Are Unpopular
By Anika Dandekar
House Republicans, engaged in debates regarding budget reconciliation, are planning to extend and expand President Trump’s 2017 tax cuts for corporations and high-income households, which are expected to cost trillions in the coming years. To pay for this, GOP Congress members have proposed slashing health care, food assistance, education funding, and many tax credits benefiting low-income communities — shifting costs to states and families.
Together with the Student Borrower Protection Center and Groundwork Collaborative, Data for Progress conducted a survey from January 31-February 2 to measure voter sentiment toward cuts to federal funding and tax breaks for the wealthy.
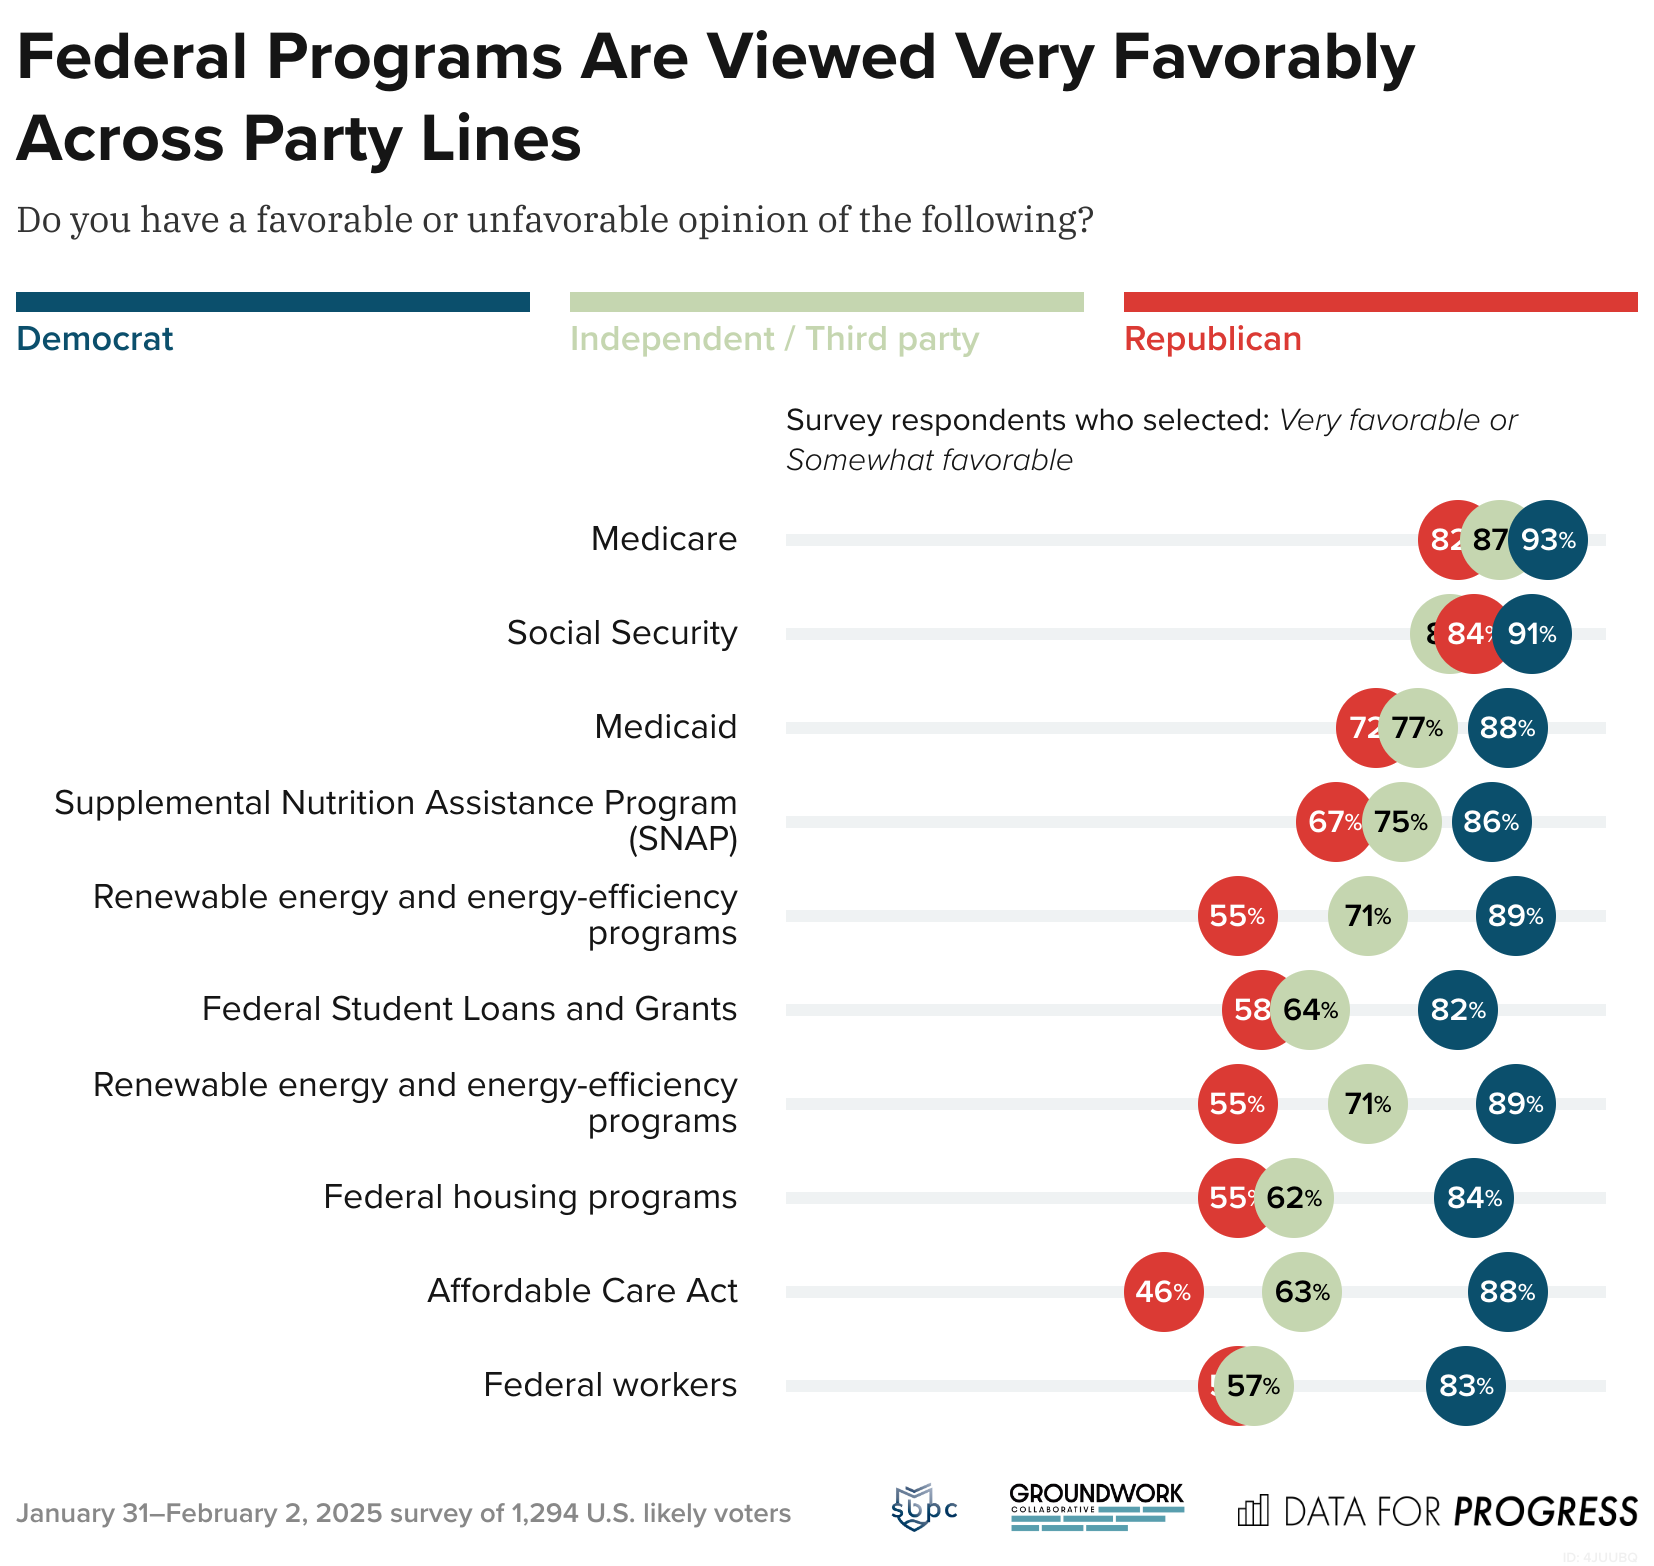
The poll shows that many government programs are very popular with likely voters: Medicare, Medicaid, Social Security, and SNAP each have support from more than 3 in 4 respondents.
Other essential programs also enjoy strong bipartisan support, including federal student loans, renewable energy and energy-efficiency programs, and federal housing programs. While the Affordable Care Act (ACA) is more polarizing, after several unsuccessful attempts to repeal it during Trump’s first term, Republicans still support the program by a +6-point net margin.
A significant majority of voters agree that the wealthy pay too little in taxes — particularly billionaires, CEOs, and corporations.
In contrast, very few voters think that middle-class and low-income earners are paying too little.

At the same time, voters support increasing funding for Social Security and Medicare, and few want to see cuts to other popular government programs.
Over 80% of voters want to increase funding or keep funding the same for Social Security, Medicare, Medicaid, and SNAP.
Additionally, fewer than 1 in 4 voters want to see cuts to federal housing programs, renewable energy programs, the ACA, or federal student loans and grants.
And while Trump has pressured millions of federal workers to resign their positions, only 24% of voters want to see cuts to the federal workforce.

Along with cuts to federal programs and tax decreases on the wealthy, specific Republican budget proposals remain unpopular with likely voters.
This includes policies related to student aid — majorities of voters oppose decreasing Pell Grant amounts, taxing student scholarships like income, eliminating Parent PLUS loans, and eliminating income-based student loan repayment.
Lowering the corporate tax rate is underwater by a -48-point margin, and 50% of voters oppose making income taxes flat across income levels.

When asked whether they prefer to keep funding for government programs and taxes unchanged to protect low-income individuals, or if they think lawmakers should increase tax incentives for wealthy households and corporations and cut programs “to reduce fraud and encourage job creators to spur research and development, strengthen benefits for workers, and boost the economy overall,” voters choose maintaining funding and keeping taxes unchanged by a +39-point margin. Majorities across parties — 80% of Democrats, 62% of Independents, and 52% of Republicans — prefer that lawmakers steer clear of tax breaks for the wealthy and program funding cuts in order to protect vulnerable groups.

This polling demonstrates that many of the Republicans’ potential budget reconciliation proposals are unpopular, as voters reject cutting taxes for wealthy Americans and slashing federal programs that lower-income Americans rely on each day. Instead, voters prefer that lawmakers reject proposed corporate tax breaks and increase funding for essential programs.
Anika Dandekar (@AnikaDandekar) is a senior analyst at Data for Progress.
Survey Methodology
From January 31 to February 2, 2025, Data for Progress conducted a survey of 1,294 U.S. likely voters nationally using web panel respondents. The sample was weighted to be representative of likely voters by age, gender, education, race, geography, and recalled presidential vote. The survey was conducted in English. The margin of error associated with the sample size is ±3 percentage points. Results for subgroups of the sample are subject to increased margins of error. Partisanship reflected in tabulations is based on self-identified party affiliation, not partisan registration. For more information please visit dataforprogress.org/our-methodology.